How to setup and use XDEBUG with PHPStorm 6/7 (locally in Windows 7/8 and Mac OS X)

Real debugging is probably one of the most coolest things that are possible in software development: Remember the times where you echoed out everything in your app like
echo $my_value;
just to see the content ? Yeah, there are better tools, like
var_dump($my_value);
or even the awesome krumo which shows your variables/objects in an interactive javascript box, but honestly, that’s amateur stuff!
Real debugging is extremely effective, extremely simple (!) and totally unknown to a large amount of PHP developers.
What is debugging ?
To say it in one sentence: You mark a (or multiple) line(s) in your code within your IDE, run your script with the browser (or by command line), and PHP/xdebug will pause your script exactly where the marker is, showing you the value of each variable/object/etc. at exactly that point in time. In your daily work you’ll set multiple markers and jump through your application, pausing/resuming with one click (or keyboard shortcut).

By the way: If you are not using an IDE like PHPStorm, NetBeans, Aptana etc. TRY IT OUT NOW ! Your life will be so much better. Seriously. In this tutorial we will use PHPStorm, which is currently the most advanced, most intuitive and most value-for-the-money IDE for PHP. It is perfect for debugging as PHPStorm needs absolutely NO CONFIGURATION (!). Love it!
Requirements
- Install your favourite Apache/MySQL/PHP stack (which has xdebug included), in this tutorial we’ll use AMPPS, which is probably the best (L)AMP stack for windows machines. It’s always up to date, has a very good interface, allows changing of PHP versions with one click, is totally config-free and offers one-click installations of popular PHP scripts, frameworks, CMS, blogs etc.! XAMPP, which is often used by beginners, does not have xdebug included. Mac users may use MAMP, which has xdebug included.
- Install PHPStorm.
Edit the php.ini
In AMPPS you can edit the php.ini (there is one for every version of PHP by the way !) via clicking the taskbar icon with right mouse button -> Configuration -> PHP. Search for the [xdebug] part, usually at the end of the file. It should look similar to this:
;debugging
zend_extension = D:\Entwicklung\Ampps\php\ext\php_xdebug-2.2.3-5.3-vc9.dll

[xdebug]
xdebug.remote_enable = on
xdebug.remote_handler=dbgp
xdebug.remote_host="127.0.0.1"
xdebug.remote_port=9000
xdebug.profiler_enable = off
xdebug.profiler_enable_trigger = off
xdebug.profiler_output_name = cachegrind.out.%t.%p
Don’t change anything here, simply add this line
xdebug.remote_autostart = on
and close the file (will be saved automatically). QUIT the entire AMPPS application (right click in taskbar icon) and start it again. This hard restart is necessary to reload the changed php.ini correctly.
Debugging !
Open PHPStorm, create a new and empy project locally, create an index.php and put this into the file:
<?php
$a = 1;
$b = 2;
$c = $a + $b;
$c++;
$d = "test";

echo $d;
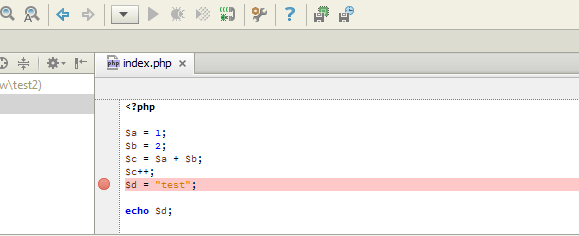
Click into the empty space left to some code lines (where the red dots in the example picture are).
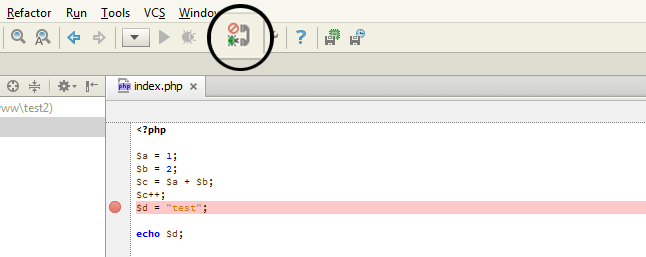
Click on the “telephone icon”, so it will change and show something green. This will make PHPStorm listen for xdebug sessions and make it pause your scripts every time it hits a marked line.
Now open your browser and run the index.php! Please note: You need to access the script exactly via the hostname provided in your php.ini, usually “127.0.0.1”. So you’ll start your demo script via 127.0.0.1/your_folder/index.php! Many people try to do that with http://localhost and wonder why nothing happens.
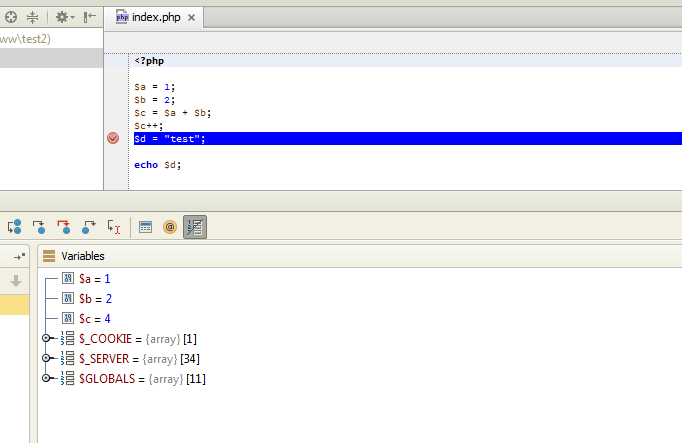
Your script will now “pause” in the browser and a debug window in PHPStorm will pop up, showing you all the variables in your script and their values at exactly that position where the red marker is. The debugging is highly interactive, you can expand the arrays and objects and even manipulate them: Right-click a variable/property to set another value.
To go on with the script press F9 or click on the green “play” button on the left side of the PHPStorm windows. To completely stop the script, click on the red “stop” button or press CTRL+F2.
Finally a little tip: You need to press that debug “telephone” button again every time when you start PHPStorm or create a new project.
Also useful: How to debug a PHP application on a remote server (with xdebug)


